GOVERNMENT data visualization product design (fortune 500 client)
In this case study I will talk about how I took a new data visualization and financial forecasting software idea from scratch to user validated high fidelity clickable prototype that were used to raise funding, for an NYSE listed Fortune 500 software provider for the United States public sector, with end users of my designs including the County of Los Angeles and State of Texas. I will highlight my process of how I combined design thinking, UX research and collaboration with various data scientists to take the high level idea of a VP through several iterations and pivots, turning it into a user validated high fidelity clickable prototype that my client used to raise funding and build out my designs.
Project kickoff
listening tour
I kicked off the project by doing a listening tour with various stakeholders of the company to understand the specific project’s vision, business goals, end users, potential barriers to success and product hypotheses. I included a wide range of stakeholders in the listening tour in order to understand and consolidate various perspectives with potentially differing goals.
Vice President of Data Solutions and Product Manager
“What is the business goal of this project?”
“Who are the end users, and what problem are we trying to solve?”
“What has been done so far for this new feature/product, can you walk me through it?”
“What do you see as being the biggest hurdle to making this project successful?”
“What are the other products under the company, can you walk me through them?”
UX/UI Designers and design leads
“Can you walk me through the design system and style guide? What is the balance between consistency of UI and usability of UI within the company?”
“What design assets do you use for wireframing?”
“What are the biggest challenges to getting good designs done at this company in general?”
“What do you see as being the biggest hurdle to making this project successful?”
Data Scientists
“Who are the end users, and what problem are we trying to solve?”
“What are the technical limitations to solving this problem?”
“What do you see as being the biggest hurdle to making this project successful?”
After the listening tour was completed, the business and projects goals, as well as product hypotheses were clearly defined.
Product hypotheses
Creating Sales Tax Revenue forecasts is a long, tedious process with many points of friction
Users have to consolidate macroeconomic data from multiple sources to create and justify financial models for their forecasts
Users have to account for outliers in data, seasonality
Users have to defend and explain their financial models to non-technical individuals in a city council setting, to get approved
Project Goals
Understand the status quo processes (how do users currently do financial forecasting)
Define product requirements
Define product use cases
Explore concept, get clickable prototype to validate concept with end users
Secure funding for new product by using user validated designs
Integrating myself into the team
I have found that for any project to be successful, I need to be integrated into the team properly so that there are no bottlenecks. As a result I was added to Slack for async feedback through Figma’s commenting feature, identifying exactly what type of feedback I’m looking for, and set up recurring meetings with the Product Manager, other senior designers, and Data Scientists. I’ve also found that loom.com allows for great async feedback.
List of unknowns
The client had some existing artifacts for the project, including user personas, several user interviews, and a couple of screens. Going through all of these, I identified the biggest gaps, which were an understanding of the end to end process of a how a user starts to create their Sales Tax Revenue Forecast, up until how they get it approved. The team had a good understanding of the statistical models the users used, but missed everything else in their research. Here were some of the unknowns that I listed out, which I then included in the contextual inquiry portion of the user research. Gaining an understanding of how end users were creating financial forecasting for their sales tax revenue, would lead to identifying the problems and friction points of the existing process, which would then lead to the designing the product in a way to solve these problems— which then would lead to product requirements, and funding.
Some examples of questions to understand the existing process were:
Versioning: How do you track the forecast, budget, in terms of open iterations, vs when it’s finalized, vs when you’re revisiting and adjusting throughout the year?
How much explanation are you giving about your forecast, regarding your models? How are you communicating this explanation?
What technology do you use for communication for feedback and revisions?
How quickly and often are you running what-if scenarios?
What’s the biggest barrier to creating your forecast?
What part of forecasting do you enjoy?
User research
contextual inquiry and user discovery interviews
None of the stakeholders had a precise idea of how things were currently being done beyond a high level understanding of the problem being that financial forecasting in the government sector is difficult. I set out to discover how users currently create sales tax revenue forecasts, what their biggest pain points are, and what they care about.
The contextual inquiry interviews consisted of users sharing their screens and walking us through, step-by-step, how they create a sales tax revenue forecast. This involved the user showing various Microsoft Excel files, emails, Microsoft Teams groups, and powerpoint presentations. This gave us a preliminary customer journey map, with various steps that users take to complete their goals.
Each of the steps were broken down into categories: Gathering data, creating 1st draft, receiving feedback and iterating, finalizing forecast. Once we had conducted several contextual inquiry interviews and saw recurring answers for the process that users currently follow, I created category that the steps in the customer journey map were divided into. At this stage I also switched us over to doing user discovery interviews in order to dig deeper into these steps. For each category, I had unique questions highlighting the unknowns, however every section had the following critical questions:
What is the goal of this step?
What are the biggest challenges to this goal?
Have you found any workarounds, or “life hacks”, for this step?
On a scale of 1-5, 1 being super easy, 5 being extremely difficult, how hard is this step?
We did several rounds of these, to finalize the customer journey map that captured the existing process that users go through, and its friction points. The unique and surprising thing that was summed up in a quote from a user was “Forecasting is more of an art than a science”. As a result, we saw quite a bit of variation in the processes that users used.

Research methodology
Unlike consumer and B2C products, I’ve found that it’s extremely useful to run user testing with medium-high fidelity clickable prototypes with business and B2B products, with the goal of discovering if the new processes and flows solve their business problems, create efficiencies in the existing way they’re solving their problems, and are enticing enough for users to switch over from their existing process. The issue with spending too many resources running usability studies on consumer and B2C products is that the issues that reveal themselves are usability issues, friction points in the flow, such as does a user understand how their username appears, or did they understand that error over there, whereas with B2B and business products, what gets revealed is if the product’s utility, if the product is even useful. The utility of B2C and consumer products are revealed through user analytics data with a proper analytics tracking plan after an MVP launch (I will write a blog post about this later, subscribe so you don’t miss it).
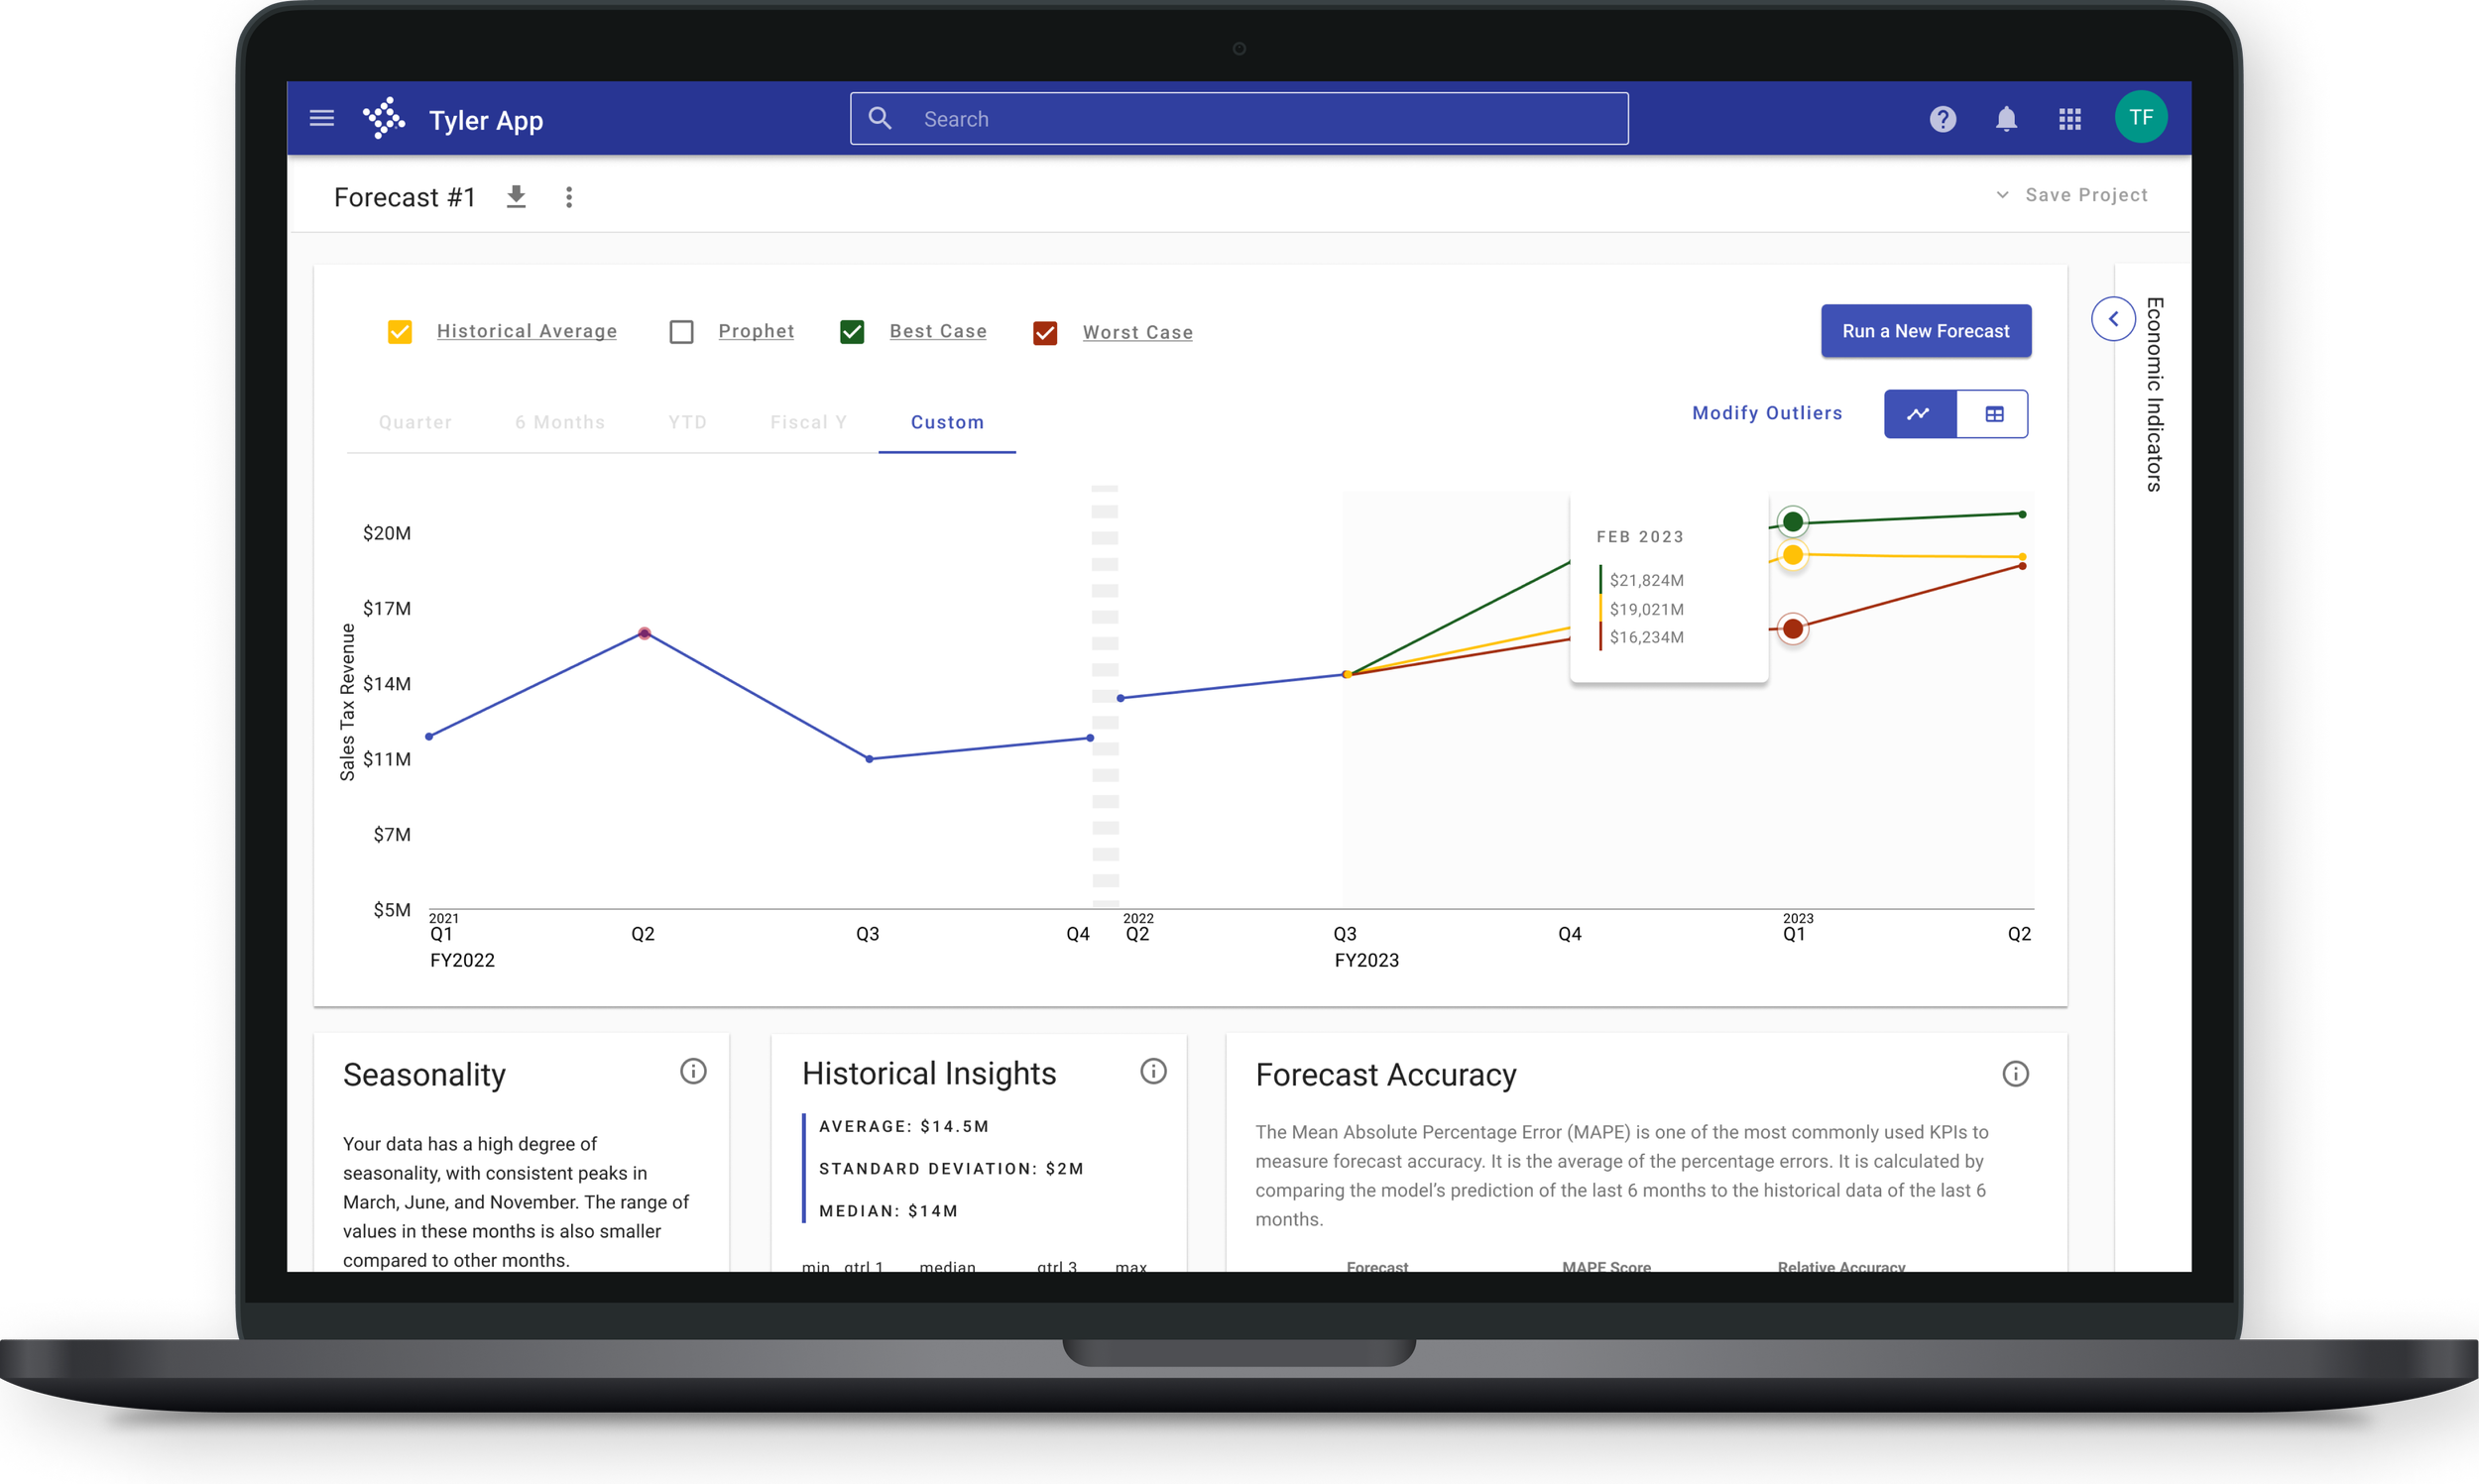
high fidelity clickable prototype
Now that we had a solid understanding of the pain points that users faced in their current processes, it was time to solve them with design. Since the client already had a very robust design system (Material Design, with a few tweaks), I opted to dramatically speed up the process of getting designs in front of users by doing “medium fidelity”, with the freedom to modify the design system as needed, since it had its own gaps and issues. I skipped the wireframes, and went straight into using their design system, keeping some aspects more simple and dirty. The goal wasn’t to be pixel perfect, it was to prioritize usability, and validate the concepts in front of real users as soon as possible.

iterations and findings
User testing research process
As I was designing and iterating on the clickable prototype, the focus was to iterate based on user feedback through research discoveries. The type of feedback gathered was quite different than what the client had (incorrectly) done before, the client had historically asked end users “do you want feature x, or do you want feature y?”. This is obviously falling into the trap of that whole story about Henry Ford, supposedly, saying “If I had asked people what they wanted, they would have said faster horses.”
The strategy I followed was a lot more based around having a user play with the clickable prototype to learn about the usability of the designs, however to find out about the utility of the designs (which features are good, and what new features should be addressed), I asked questions such as
Which feature stood out to you the most and why?
Which feature stood out to you the least, and why?
What would be the biggest barrier to you using this product?
These questions quickly revealed a pattern that debunked the original hypothesis being that macroeconomic indicators are hard to aggregate and include in the forecasts, so we quickly pivoted to focusing on the feature that every user test said stood out to them the most, which was creating what-if-scenarios.
Due to the frequency that the Product Manager was able to get me users to test with (highly specialized users, financial forecasters working at a government role), I did a hybrid of user testing and user discovery interviews. This allowed me to utilize the time and resources more efficiently, validate new designs, while at the same time digging even deeper into their existing processes.
How would you describe this page? What do you think you can do here?
Create one scenario if Walmart opened in your town in September
Can you explain what just happened?
Create a separate scenario for if a recession started in July
Can you explain what just happened?
In the Walmart scenario, what would you do if legislation passed as well?
Can you explain what just happened?
How could you see this information impacting your forecasting process?
How do you typically deal with what-if-scenarios such as this?
How would you interpret the graph?
What would you want to do next?
This is one of the versions of the clickable prototypes that I designed from scratch and iterated upon based on user testing feedback that I received as part of a larger UX Research and Product Design process.
Feature requests
Throughout the user testing process, various stakeholders had feature requests. The way I approached incorporating them, was to design minimal viable versions of these requested features, and user test them to see how much such features resonated with end users. An example of this, was a smoothening feature request that came from the Data Scientists. The Data Scientists had devised an algorithm where a user can click a button, and automatically any outliers in the data were detected, and modified.

I made these designs clickable, and presented them to users, asking questions such as:
How would you describe what just happened?
How would you see yourself using this feature in the real world?
This started conversations with the users, and revealed that they did not understand the mechanism behind the automatic smoothening, which posed problems for how they would describe their forecasts to city council. Also, they said that what they actually want is to be able to modify specific data points one-by-one, even if it might not be a statistical outlier, it could be an outlier due to internal knowledge held by the forecaster. As a result, I created another iteration, removing the smoothening feature, and solving for what the users had requested.

These designs resonated much better with the users compared to the original feature request which came from the Data Scientists, and due to the process I used to reach this stage, there was buy-in from the Data Scientists, VP and Product Manager.
Documentation of research
The goal of the project was to validate the concept of this forecasting tool, and use the validation to raise funding internal in the company, as a result documentation of findings were extremely important. As a part of this, I included a change log between each prototype version, key learnings, key quotes, stand-out feature, and more.

project success and handoff
Due to my process and research, I was able to give the team validated product requirements, user flows, designs, and use cases. The Product Manager used my research documentation, and clickable prototypes to present internally in the company, where she successfully raised funding for the project. I typically stay on with the client during the development phase especially to support them in their user analytics tracking plan, but due to financial reasons the client decided to hire a Jr Designer and put her on the project to support developers. I onboarded the Jr Designer in multiple sessions and walked her through all of the iterations that I had done, all of the learnings, the research methodology, and gave her a list of next steps in order for the product to be successful in development.

